§04 Dev & Infrastructure
Where the Milliseconds Go: Reading a Latency Budget End to End
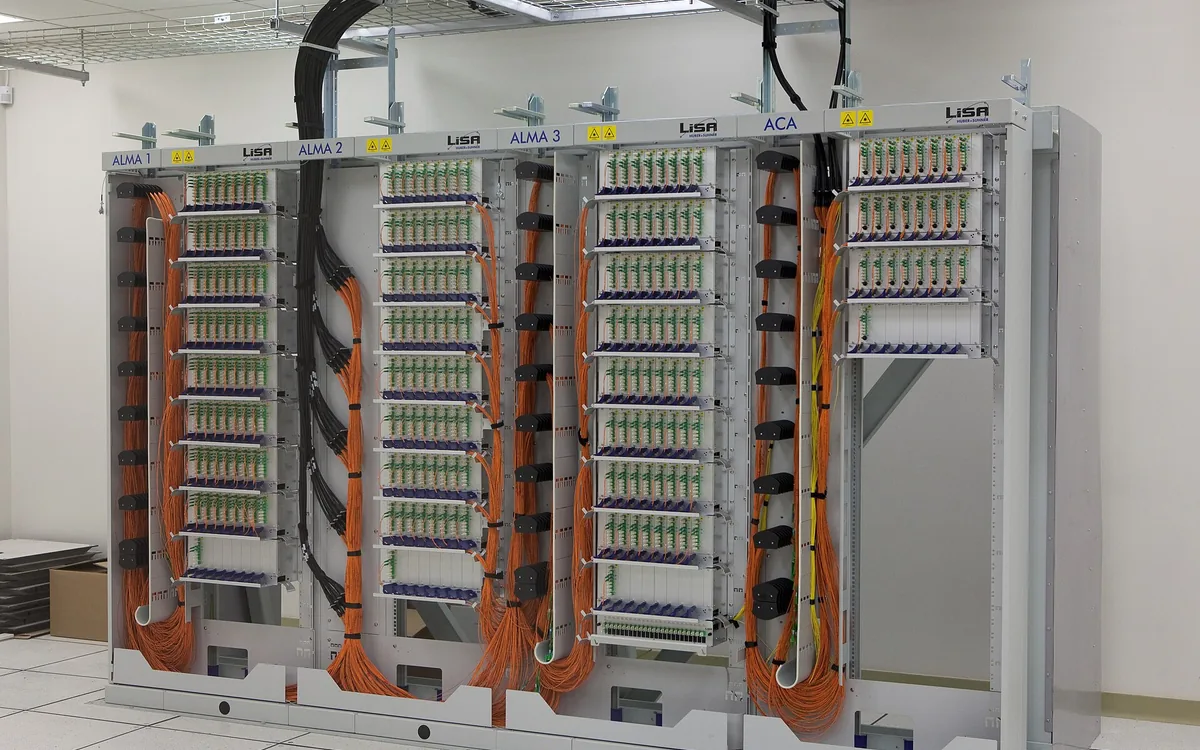
ALMA fibre optic patch panel (alma aos mar2009-1815) / ALMA (ESO/NAOJ/NRAO), CC BY 4.0
A web request from a user action to a visible response time is a series of costs paid across the request path. And the useful question is not “what is the total latency?” but rather, “where do the milliseconds go?” We can say more about that by splitting the end-to-end time into stages and budgeting for each.
A latency budget is a fixed time window allocated for a full user request. It is a commitment that a user perceives a response so quickly that they are not aware of waiting. In practice, that usually means a p99 latency of under 300 ms, where 99% of requests respond in that time and 1% take longer.
A complete request moves from the browser to the internet, to the network edge, to the server, then back to the browser. Each stage eats into the budget.
Most of the milliseconds are in the cold request, when the browser has not already looked up the origin, established a TCP connection, or cached any resource. DNS alone takes one or two round trips, so does the initial TCP handshake and the TLS session.
For example, a cold HTTPS request to a distant origin can spend about one round trip on DNS, one on the TCP handshake, one on the TLS 1.3 handshake, and then more time as slow start ramps up the Congestion Window. That same cold HTTPS request can take 200–300 ms before useful content over a long-RTT link.
"So if a cold HTTPS request to underperformant origin can do 10 round trips and 250ms of latency in the slow start, that's about 2.5s of load time, dominated by network, before the app or browser is even involved (the requested HTML is not desirable, and things don't get rendered anyway)."
A critical portion also happens after the server responds, when the browser parses the HTML, loads the necessary resources, and renders the page. The time for a response to make it into the user’s eyes, the render delay, is part of the latency budget just as much as network or server time.
"Rendering is not free, but you don't have to think about it until it's a problem. For large pages, or pages that require two browser round trips just to display, that might be 200ms. That's because the browser does a full round trip to load subresource files, and then another round trip to load the rest of the HTML once they are done (that's the critical rendering path). Too much happening in the async queue, or excessive dependencies between resources, and you will hit render delay."
The total budget must be divided across every link in the chain. Provided the application moves 300 ms /P99, there's only about available for the one server hop. So typically that would be split between the cache and origin server. The cache can run at /P99 and the origin at /P99. Queries from cache to origin can run at /P99.
It is important to measure and check each hop against its allocation. That minimizes the game of guessing, because the slow layer is no longer a mystery. Sorting hop profiling to start with the P99 tail is especially effective, because by definition 1% of requests will hit that part. Measuring against commitments is therefore realistic.
But there are common mistakes that invalidate a latency budget. Percentiles are aggregated over many requests, not averaged. The right way is to combine the underlying distributions, or mergeable summaries of them, then take the percentile. It does not work to calculate, for instance, the p95 of each server and them average. Averaging percentiles across limits like hosts or windows will return unknown results and hide the tail.
Because percentiles measure the points where fractions of requests happen by, and 99% of requests is all but 1%, P99 latency may be a closer predictor of user experience than average latency. But it does not measure the maximum request time. On a given release of a client or server, or a given network configuration, p99 could be the latency you guarantee to underperform 1% of the requests.
"99th-percentile metrics can be very revealing. Too often, people look at averages in a search for global status. Averages are cheaters; they mask outliers. Really long request times muddy averages by so much, that 99% of request latencies can look okay when an average response time value is over budget. Averages hide the very real increased latency that can impact user experience."
So a latency budget that starts with the top for user action but works by tracking each hop is a clear and realistic system. The goal is not to be in a perfect world, but to pick the right part of the request path to optimize, or focus on the worst offenders. Optimizing cold requests is critical where the user and server have not yet spun up TLS or loaded resources. And the cost of each part is very real, from DNS and TLS to slow start and render delay.
Given the headroom remaining after requests have gone through the browser and internet layers, a useful finishing question is “how long can my 300 ms total budget last?” in the remaining hops. Each applicable step is worth measuring separately, and nearly always worth optimizing, but the aim is to distribute the budget informed by the experience of making and waiting for a request end to end.